
How to Monitor NVIDIA GPUs on Kubernetes with DCGM Exporter, Prometheus & Grafana
A detailed guide to monitoring NVIDIA GPUs on Kubernetes with DCGM Exporter, Prometheus, and Grafana, including dashboards, alerts, MIG metrics, and troubleshooting.
Kubernetes knows whether a pod requested a GPU. It does not know whether that GPU is busy, out of memory, overheating, throttling, accumulating hardware errors, or sitting idle while you pay for it.
A useful GPU monitoring stack connects three layers:
- NVIDIA DCGM Exporter reads GPU telemetry and exposes it in Prometheus format.
- Prometheus discovers exporter endpoints, scrapes metrics, stores time series, and evaluates alert rules.
- Grafana turns those metrics into fleet, node, GPU, MIG, and workload dashboards.
This guide builds that pipeline on Kubernetes, verifies each stage, adds practical dashboards and alerts, and explains the operational details that frequently cause empty panels or misleading conclusions.
Architecture
The data path is:
NVIDIA GPU
    ↓
DCGM / DCGM Exporter DaemonSet on each GPU node
    ↓  HTTP /metrics on port 9400
Kubernetes Service + ServiceMonitor
    ↓
Prometheus
    ↓
Grafana dashboards and Prometheus alert rules
DCGM Exporter should run once on each monitored GPU node. It uses NVIDIA Data Center GPU Manager libraries to collect device telemetry, enriches samples with GPU and Kubernetes metadata, and publishes a Prometheus endpoint.
The default endpoint is:
http://<exporter-address>:9400/metricsWhat you should monitor
A production dashboard should answer four different questions.
| Question | Example metrics | Why it matters |
|---|---|---|
| Is the GPU doing useful work? | DCGM_FI_DEV_GPU_UTIL, DCGM_FI_PROF_SM_ACTIVE | Finds idle reservations and saturation |
| Is memory a constraint? | DCGM_FI_DEV_FB_USED, DCGM_FI_DEV_FB_FREE | Explains OOM failures and sizing limits |
| Is the device healthy? | XID, ECC, temperature, throttling signals | Detects failures before workloads disappear |
| Is data collection healthy? | up, scrape duration, absent metrics | Separates telemetry failure from an idle GPU |
Power, clocks, PCIe traffic, NVLink, encoder/decoder activity, and MIG telemetry are also useful, depending on the workload and hardware. NVIDIA documents the shipped fields in the DCGM Exporter metrics reference.
Not every GPU supports every DCGM field. A configured collector field is not guaranteed to appear: availability depends on hardware, driver, DCGM version, permissions, entity type, and profiling-group compatibility.
Prerequisites
You need:
- A working Kubernetes cluster with NVIDIA GPU nodes.
- A compatible NVIDIA driver and container runtime.
kubectlandhelmaccess.- NVIDIA GPU Operator, or permission to install DCGM Exporter separately.
- Prometheus Operator CRDs if you plan to use a
ServiceMonitor. - Prometheus and Grafana, either existing or installed through a monitoring chart.
Confirm that Kubernetes sees GPU capacity:
kubectl get nodes -o custom-columns=NAME:.metadata.name,GPU:.status.allocatable.nvidia\.com/gpuConfirm that a test workload can run nvidia-smi before debugging monitoring. Telemetry cannot compensate for a broken driver or container runtime.
Step 1: Check whether GPU Operator already deployed DCGM Exporter
A default NVIDIA GPU Operator deployment includes DCGM Exporter. Check before installing another copy:
kubectl get daemonset,pods,service -n gpu-operator | grep dcgm-exporterFind the actual namespace if your Operator is elsewhere:
kubectl get pods -A -l app=nvidia-dcgm-exporterYou want one ready exporter pod on each intended GPU node:
kubectl get pods -n gpu-operator -l app=nvidia-dcgm-exporter -o wideDo not deploy the standalone chart on the same nodes when GPU Operator already manages the exporter. Duplicate exporters waste resources, complicate discovery, and can create duplicate time series.
If DCGM Exporter was disabled in the GPU Operator installation, enable it through your managed Helm values and upgrade workflow. Keep chart values in version control rather than making undocumented live changes.
Alternative: install DCGM Exporter with NVIDIA's Helm chart
Use this path only when GPU Operator is not managing the exporter.
Add NVIDIA's chart repository:
helm repo add dcgm https://nvidia.github.io/dcgm-exporter/helm-charts
helm repo update
Inspect available and installed versions:
helm search repo dcgm/dcgm-exporter --versionsInstall a version you have tested:
helm upgrade --install dcgm-exporter dcgm/dcgm-exporter --namespace gpu-monitoring --create-namespace --version <tested-chart-version> --set serviceMonitor.enabled=true --set serviceMonitor.interval=30s --set serviceMonitor.scrapeTimeout=25sThe chart deploys an exporter pod on each selected GPU node and enables Kubernetes pod mapping. NVIDIA recommends pairing the exporter and DCGM versions shipped together; mismatched versions are untested.
If Prometheus selects ServiceMonitor objects by label, supply that label in Helm values. A typical kube-prometheus-stack installation uses a release label:
serviceMonitor:
  enabled: true
  interval: 30s
  scrapeTimeout: 25s
  additionalLabels:
    release: kube-prometheus-stack
The exact label depends on your Prometheus resource. Verify its selectors rather than copying this value blindly.
Step 2: Install or verify Prometheus and Grafana
If you already have Prometheus Operator and Grafana, skip installation and inspect their selectors in the next step.
A common all-in-one option is the community kube-prometheus-stack chart:
helm repo add prometheus-community   https://prometheus-community.github.io/helm-charts
helm repo update

helm search repo prometheus-community/kube-prometheus-stack --versions
Install a tested chart version:
helm upgrade --install kube-prometheus-stack prometheus-community/kube-prometheus-stack --namespace monitoring --create-namespace --version <tested-chart-version>Verify the components:
kubectl get pods -n monitoring
kubectl get prometheus,servicemonitor -A
For production, configure persistent Prometheus storage, retention, resource requests, high availability where required, and a durable Grafana database. The default chart values are suitable for evaluation, not necessarily your retention or availability requirements.
Step 3: Make Prometheus discover DCGM Exporter
Prometheus Operator watches ServiceMonitor resources admitted by the Prometheus object's label and namespace selectors.
List exporter Services and ServiceMonitors:
kubectl get service,servicemonitor -A | grep dcgmInspect the Prometheus selectors:
kubectl get prometheus -n monitoring -o yamlPay attention to:
spec.serviceMonitorSelectorspec.serviceMonitorNamespaceSelector- Labels on the DCGM
ServiceMonitor - The namespace containing that
ServiceMonitor - The Service labels and ServiceMonitor selector
- The Service port name referenced by the ServiceMonitor endpoint
A valid ServiceMonitor can still be ignored when its labels or namespace are outside Prometheus's selectors.
If GPU Operator created the exporter Service but no ServiceMonitor, create one that matches the Service's real labels and port name. Inspect them first:
kubectl get service -n gpu-operator -l app=nvidia-dcgm-exporter -o yamlThen adapt this example:
apiVersion: monitoring.coreos.com/v1
kind: ServiceMonitor
metadata:
  name: nvidia-dcgm-exporter
  namespace: monitoring
  labels:
    release: kube-prometheus-stack
spec:
  namespaceSelector:
    matchNames:
      - gpu-operator
  selector:
    matchLabels:
      app: nvidia-dcgm-exporter
  endpoints:
    - port: gpu-metrics
      path: /metrics
      interval: 30s
      scrapeTimeout: 25s
The app label and gpu-metrics port are examples. They must match the Service deployed in your cluster.
Keep scrapeTimeout below interval. Scraping more frequently than DCGM's effective collection cadence can return the same cached value repeatedly; it does not force a new hardware sample.
Step 4: Verify the exporter endpoint
Start at the source before opening Grafana.
Check exporter logs:
kubectl logs -n gpu-operator -l app=nvidia-dcgm-exporter -c nvidia-dcgm-exporter --tail=100Use a temporary port-forward to inspect one endpoint:
kubectl port-forward -n gpu-operator service/nvidia-dcgm-exporter 9400:9400In another terminal:
curl -s http://127.0.0.1:9400/metrics | grep -E 'DCGM_FI_DEV_GPU_UTIL|DCGM_FI_DEV_FB_USED' | headExpected samples look similar to:
DCGM_FI_DEV_GPU_UTIL{gpu="0",UUID="GPU-...",device="nvidia0",modelName="NVIDIA H100 80GB HBM3",...} 72
DCGM_FI_DEV_FB_USED{gpu="0",UUID="GPU-...",device="nvidia0",modelName="NVIDIA H100 80GB HBM3",...} 24576
Exact label names vary by exporter version and configuration. Current DCGM Exporter Kubernetes mapping uses pod, namespace, and container; older configurations can expose legacy names.
Step 5: Verify the Prometheus target
Open Prometheus locally:
kubectl port-forward -n monitoring service/kube-prometheus-stack-prometheus 9090:9090Open http://127.0.0.1:9090/targets and find the DCGM Exporter target. It must be UP.
Run two smoke-test queries:
up{job=~".*dcgm.*"}DCGM_FI_DEV_GPU_UTILThe first proves that Prometheus can scrape the target. The second proves that the target exposes a selected GPU field. An UP target with no DCGM fields often indicates a collector, driver, permission, or compatibility issue.
Useful inventory queries include:
count(DCGM_FI_DEV_GPU_UTIL)count by (modelName) (DCGM_FI_DEV_GPU_UTIL)count by (Hostname) (DCGM_FI_DEV_GPU_UTIL)Check which hostname label your exporter actually emits before standardizing dashboards. Some installations relabel Hostname to instance or node.
Step 6: Connect Grafana to Prometheus
kube-prometheus-stack provisions Prometheus as a Grafana data source automatically. For a separate Grafana installation, add Prometheus as a data source using an in-cluster URL such as:
http://kube-prometheus-stack-prometheus.monitoring.svc:9090The exact Service name depends on the Helm release.
To access Grafana temporarily:
kubectl port-forward -n monitoring service/kube-prometheus-stack-grafana 3000:80Open http://127.0.0.1:3000. Retrieve credentials according to your chart values or secret-management workflow. Do not expose Grafana publicly with default credentials.
Step 7: Import or build a GPU dashboard
NVIDIA publishes the DCGM Exporter Grafana dashboard. In Grafana:
- Open Dashboards → New → Import.
- Enter dashboard ID
12239. - Select the Prometheus data source.
- Import and inspect the variable queries.
- Adjust label names when your Prometheus relabeling differs from the dashboard.
Treat imported dashboards as a starting point. Keep the final JSON in version control or provision it through a ConfigMap so edits survive pod replacement.
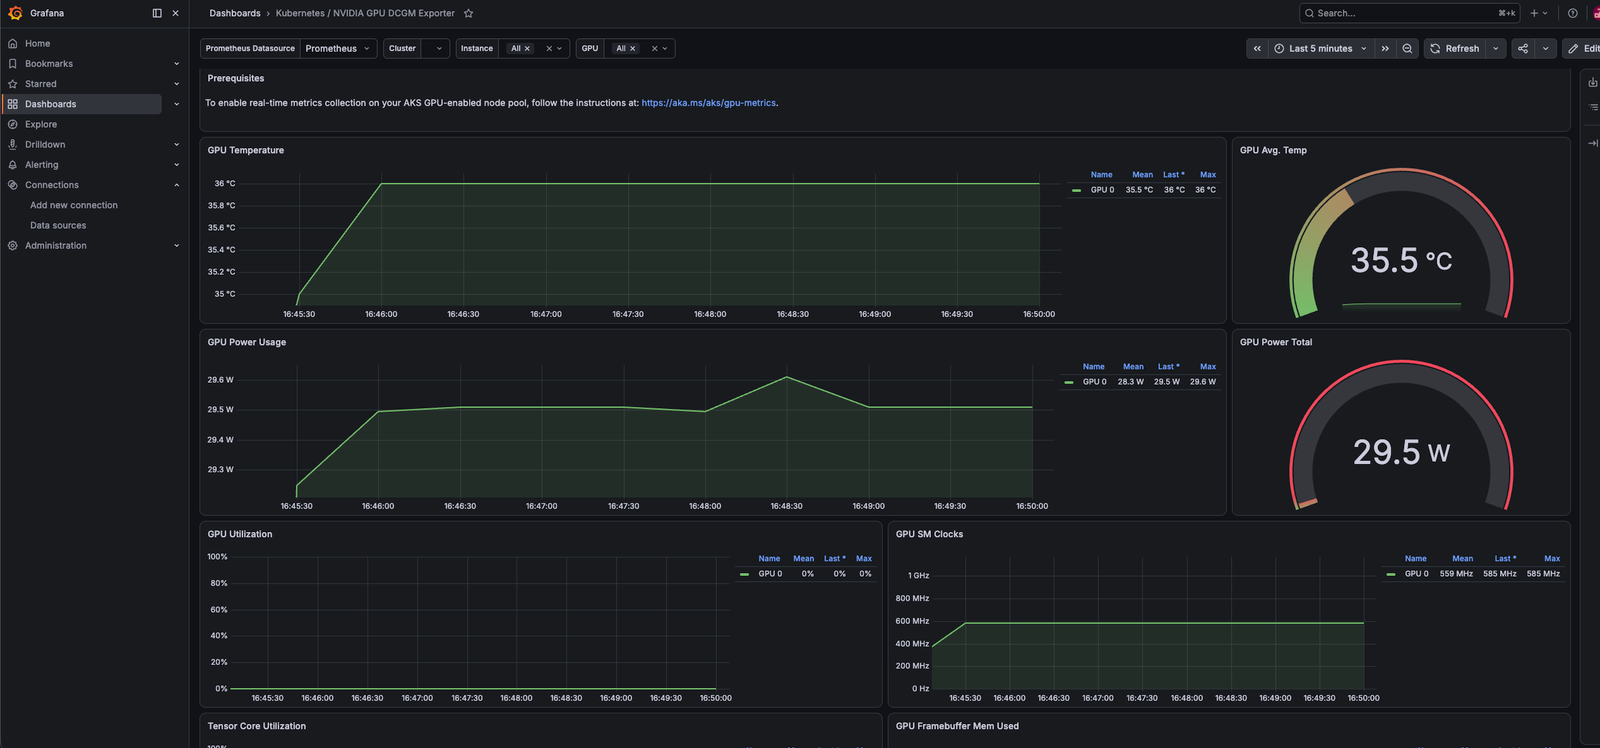
A useful fleet dashboard should include:
- GPU utilization by node, model, and UUID.
- Frame-buffer memory used and available.
- GPU temperature and power draw.
- XID and ECC error signals.
- SM clocks and memory clocks.
- PCIe or NVLink throughput where supported.
- Pods and namespaces assigned to GPUs.
- Exporter target health.
- GPU count and model inventory.
- MIG profile and instance dimensions when MIG is enabled.
Practical PromQL queries
Average utilization by node:
avg by (Hostname) (DCGM_FI_DEV_GPU_UTIL)Utilization per physical GPU:
avg by (Hostname, gpu, UUID, modelName) (
  DCGM_FI_DEV_GPU_UTIL
)
Frame-buffer memory usage percentage:
100 *
DCGM_FI_DEV_FB_USED
/
clamp_min(
  DCGM_FI_DEV_FB_USED + DCGM_FI_DEV_FB_FREE,
  1
)
Power by node:
sum by (Hostname) (DCGM_FI_DEV_POWER_USAGE)Maximum temperature per node:
max by (Hostname) (DCGM_FI_DEV_GPU_TEMP)GPU utilization by Kubernetes workload, when pod mapping is available:
avg by (namespace, pod, container) (
  DCGM_FI_DEV_GPU_UTIL{pod!=""}
)
Allocated but lightly used GPUs require care. DCGM telemetry alone shows use, not Kubernetes reservation state. Combine DCGM metrics with kube-state-metrics or another allocation signal before declaring a GPU wasteful.
Step 8: Add alert rules
Start with a small set of actionable alerts. Tune thresholds to the GPU model and workload baseline rather than treating example numbers as universal.
apiVersion: monitoring.coreos.com/v1
kind: PrometheusRule
metadata:
  name: nvidia-gpu-alerts
  namespace: monitoring
  labels:
    release: kube-prometheus-stack
spec:
  groups:
    - name: nvidia-gpu.rules
      rules:
        - alert: DCGMExporterDown
          expr: up{job=~".*dcgm.*"} == 0
          for: 5m
          labels:
            severity: critical
          annotations:
            summary: "DCGM Exporter target is down"
            description: "Prometheus cannot scrape {{ $labels.instance }}."

        - alert: GPUMetricsMissing
          expr: absent(DCGM_FI_DEV_GPU_UTIL)
          for: 10m
          labels:
            severity: critical
          annotations:
            summary: "No GPU utilization metrics are available"

        - alert: GPUHighTemperature
          expr: DCGM_FI_DEV_GPU_TEMP > 85
          for: 5m
          labels:
            severity: warning
          annotations:
            summary: "GPU temperature is high"
            description: "{{ $labels.UUID }} reports {{ $value }} degrees Celsius."

        - alert: GPUFramebufferMemoryHigh
          expr: |
            100 * DCGM_FI_DEV_FB_USED
            / clamp_min(
                DCGM_FI_DEV_FB_USED + DCGM_FI_DEV_FB_FREE,
                1
              ) > 95
          for: 10m
          labels:
            severity: warning
          annotations:
            summary: "GPU frame-buffer memory usage is above 95%"
Apply and verify:
kubectl apply -f nvidia-gpu-alerts.yaml
kubectl get prometheusrule -n monitoring nvidia-gpu-alerts
Before alerting on ECC or XID fields, query your exporter's /metrics endpoint and consult the current DCGM field reference. Metric availability and semantics differ across versions and hardware. A counter increase generally needs increase(); a current-state gauge needs a different expression.
Route alerts through Alertmanager with ownership, severity, runbook links, and inhibition rules. An alert without a response path is only a noisy dashboard.
Custom metrics with a collector ConfigMap
The default collector is a sensible baseline, but you might need profiling fields, NVLink metrics, or additional health signals.
A DCGM collector CSV uses exactly three columns:
DCGM field,Prometheus type,help textExample:
apiVersion: v1
kind: ConfigMap
metadata:
  name: dcgm-exporter-metrics
  namespace: gpu-operator
data:
  metrics: |
    DCGM_FI_DEV_GPU_UTIL,gauge,GPU utilization in percent.
    DCGM_FI_DEV_FB_USED,gauge,Frame-buffer memory used in MiB.
    DCGM_FI_DEV_FB_FREE,gauge,Frame-buffer memory free in MiB.
    DCGM_FI_DEV_GPU_TEMP,gauge,GPU temperature in Celsius.
    DCGM_FI_DEV_POWER_USAGE,gauge,Power draw in watts.
    DCGM_FI_PROF_SM_ACTIVE,gauge,Fraction of time an SM is active.
Connecting that ConfigMap differs between GPU Operator and standalone chart versions. Use the values schema for the exact version you deploy.
Adding a field does not guarantee output. Profiling metrics can be mutually constrained by DCGM metric groups, and unsupported fields are skipped. Validate the effective /metrics output after every collector change.
Kubernetes workload labels and cardinality
With Kubernetes mapping enabled, DCGM Exporter reads the kubelet pod-resources socket and can attach pod, namespace, and container labels to metrics for allocated devices.
Newer versions can also add pod UID and selected pod labels. Enable these cautiously:
- Every unique label combination creates another Prometheus time series.
- Deployment-generated pod names increase churn.
- Arbitrary team labels can cause high cardinality.
- Pod metadata access adds RBAC permissions.
GPU Operator exposes settings for pod labels, pod UID, and an allowlist regex. Prefer a narrow allowlist for stable dimensions such as team, service, or workload class.
MIG monitoring
DCGM Exporter can expose metrics for MIG GPU instances. MIG samples include profile and instance labels such as GPU_I_PROFILE and GPU_I_ID when supported.
For MIG dashboards:
- Group by GPU UUID, GPU instance ID, and profile.
- Do not compare raw utilization across differently sized profiles as if their capacities were identical.
- Confirm the selected DCGM fields support MIG entities.
- Keep physical-GPU health panels alongside per-instance workload panels.
- Verify pod-to-MIG mapping through the kubelet pod-resources integration.
An empty MIG panel can mean the query expects physical-GPU labels, the field is not supported for a MIG entity, or the exporter is selecting the wrong entity set.
Time-slicing limitations
Time-slicing creates multiple Kubernetes access slots for one physical GPU but does not partition memory or compute. Monitoring must not present those slots as equal physical devices.
Traditional exporter versions cannot reliably associate ordinary physical-GPU samples with individual time-sliced containers. Current DCGM Exporter versions include virtual-GPU mapping support for supported sharing paths, but availability depends on the device-plugin and exporter configuration. Always verify the labels in your own /metrics output.
For shared GPUs:
- Show physical-GPU saturation and memory first.
- Add application latency, throughput, and queue metrics.
- Avoid dividing utilization by replica count.
- Do not infer per-pod cost from advertised replicas.
- Alert on contention symptoms, not an assumed equal share.
Troubleshooting
| Symptom | Likely cause | What to check |
|---|---|---|
| No exporter pod on a GPU node | Node labels, tolerations, Operator policy, or unsupported node | DaemonSet desired/current counts and scheduling events |
| Exporter is restarting | Driver/DCGM mismatch, GPU access, or configuration error | Exporter logs, driver pod, nvidia-smi |
/metrics works but target is absent | ServiceMonitor selector or namespace mismatch | Prometheus selectors and ServiceMonitor labels |
Target is DOWN | Service port, network policy, TLS, or timeout | Target error, Endpoints, Service port, NetworkPolicy |
Target is UP but GPU query is empty | Unsupported or unselected field | Effective endpoint output and collector config |
| Grafana dashboard is empty | Wrong data source, job filter, or label names | Run panel query directly in Prometheus |
| Pod labels are blank | No allocated GPU, pod-resources socket unavailable, or mapping disabled | Exporter mounts, flags, and workload allocation |
| Duplicate series | Two exporters scrape the same GPU or duplicate discovery | DaemonSets, Services, and Prometheus targets |
| MIG values look wrong | Query mixes physical GPUs and MIG instances | Entity and profile labels |
| Prometheus memory grows quickly | Excess labels or scrape frequency | Series count, pod-label allowlist, retention |
Useful diagnostic commands:
kubectl get daemonset,pods,service,endpoints -A   | grep dcgm

kubectl get servicemonitor -A   -o wide

kubectl describe pod -n gpu-operator   <dcgm-exporter-pod>

kubectl logs -n gpu-operator   <dcgm-exporter-pod>   -c nvidia-dcgm-exporter

kubectl get --raw   /api/v1/nodes/<gpu-node>/proxy/metrics/resource
The last endpoint is kubelet resource telemetry, not DCGM telemetry, but it can help distinguish general node-metrics problems from exporter-specific problems.
Production checklist
Before relying on the stack:
- Exporter pods are ready on every intended GPU node.
- Exactly one exporter monitors each device.
- Prometheus targets remain
UPacross node replacements. - GPU utilization and memory metrics change under a known test workload.
- Dashboards filter correctly by cluster, node, model, GPU UUID, namespace, and pod.
- Alerts have been tested and route to an owner.
- Prometheus has persistent storage and appropriate retention.
- Grafana dashboards and data sources are provisioned from version-controlled configuration.
- Pod-label collection has an explicit cardinality policy.
- MIG and time-slicing views have been validated against actual scheduling behavior.
- Driver, GPU Operator, DCGM, and exporter upgrades are tested together.
The result should let you move from “Kubernetes scheduled a GPU” to “this workload used this device, at this utilization and memory level, while the hardware remained healthy.” For a managed implementation, see GPU Observability or talk to us.