Protect workload performance
Correlate latency and failures with saturation, memory pressure, thermal throttling, and driver health.
 gpufleetContact →
gpufleet gives Kubernetes teams visibility into GPU health, utilization, and workload behavior so they can operate capacity with confidence.
Talk to gpufleet →Kubernetes can schedule a GPU, but that alone does not show whether the device is healthy, saturated, underused, or causing workload failures. GPU observability connects hardware and workload signals so teams can troubleshoot faster and make better capacity decisions.
GPUs are expensive, stateful devices with their own memory, thermals, power limits, drivers, and error conditions. Kubernetes knows that a pod requested a GPU, but hardware telemetry reveals whether that GPU is doing useful work, approaching a limit, or beginning to fail. That makes GPU monitoring most important at the point where cost, workload performance, and hardware health meet.
Correlate latency and failures with saturation, memory pressure, thermal throttling, and driver health.
Find allocated-but-idle GPUs and right-size workloads before unused capacity becomes recurring cost.
Use ECC, temperature, exporter, and node signals to act before an unhealthy device disrupts production.
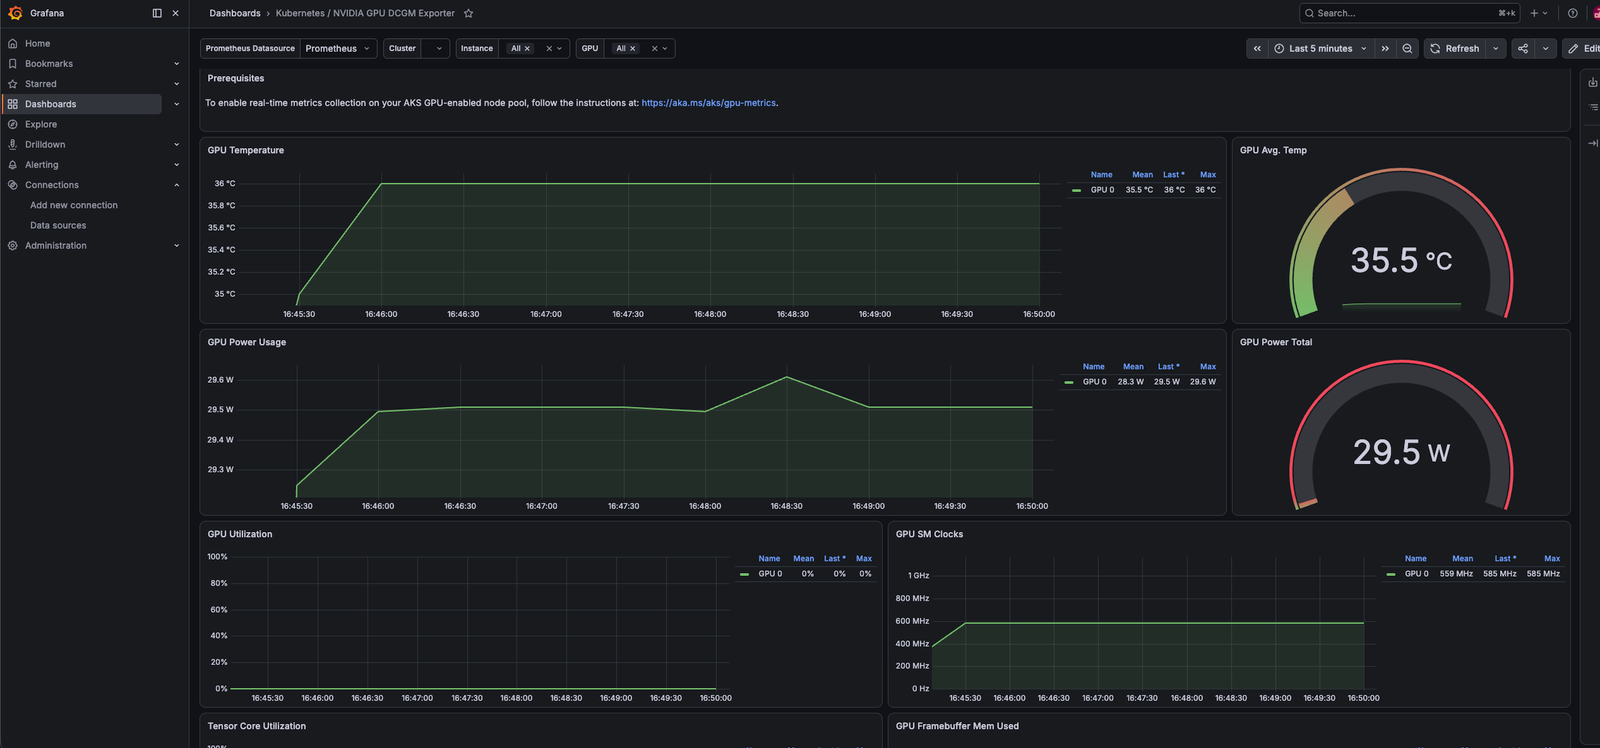
We deploy and configure NVIDIA DCGM Exporter on GPU nodes, Prometheus for collection and time-series storage, and Grafana for dashboards and alert visibility.
GPU thermal threshold breachedgpu-node-03 · GPU 1 · 87°C for 6m
Uncorrectable ECC error detectedgpu-node-07 · GPU 0 · count 1
Allocated GPU is idleinference/embedder-6c8d · utilization 4% for 32m
| GPU | MIG instance | Profile | Namespace / pod | GPU util | Memory |
|---|---|---|---|---|---|
| GPU 0 | GI 0 / CI 0 | 1g.5gb | inferenceembedder-6c8d | 74% | 4.2 GiB |
| GPU 0 | GI 1 / CI 0 | 1g.5gb | inferencereranker-74bf | 61% | 3.8 GiB |
| GPU 0 | GI 2 / CI 0 | 2g.10gb | visiondetector-api-2 | 88% | 8.9 GiB |
| GPU 1 | Full GPU | nvidia.com/gpu | trainingfinetune-job-0 | 96% | 37.1 GiB |
Thresholds are tuned to the GPU model and workload baseline. These examples show the concrete conditions we typically start from.
allocated = true AND utilization < 10% for 30mFlags a GPU that is more than 90% idle while still reserved by a workload.
temperature > 85°C for 5m OR throttling = trueDetects sustained heat or active thermal throttling; the final threshold is hardware-specific.
uncorrectable_ecc > 0 OR corrected_ecc increasingTreats uncorrectable errors as urgent and rising corrected errors as an early degradation signal.
up{job="dcgm-exporter"} = 0 for 5mSurfaces exporter loss, an unreachable node, or a possible NVIDIA driver crash for investigation.
We help you select, configure, and operate the Kubernetes GPU capabilities your team needs.
Talk to gpufleet →