
Monitoring vLLM on Kubernetes: Tokens, Latency, KV Cache and GPU Metrics
A practical guide to monitoring vLLM on Kubernetes with Prometheus, Grafana, and DCGM Exporter, covering token throughput, TTFT, inter-token latency, KV cache pressure, queues, and GPU health.
An HTTP request rate and a green readiness probe do not tell you whether an LLM service is healthy. A vLLM pod can be reachable while its queue grows, time to first token violates an SLO, the KV cache approaches capacity, or an expensive GPU spends most of its time idle.
Useful vLLM monitoring joins two views:
- Serving metrics from vLLM explain demand, token throughput, latency, scheduling, and KV cache pressure.
- Device metrics from NVIDIA DCGM Exporter explain GPU utilization, framebuffer memory, power, temperature, and hardware health.
Prometheus can scrape both sources and Grafana can place them on one dashboard. The result lets an operator move from “latency is high” to a much better diagnosis: “prefill traffic rose, the scheduler queue formed, KV cache stayed above 90%, and every replica was GPU-saturated.”
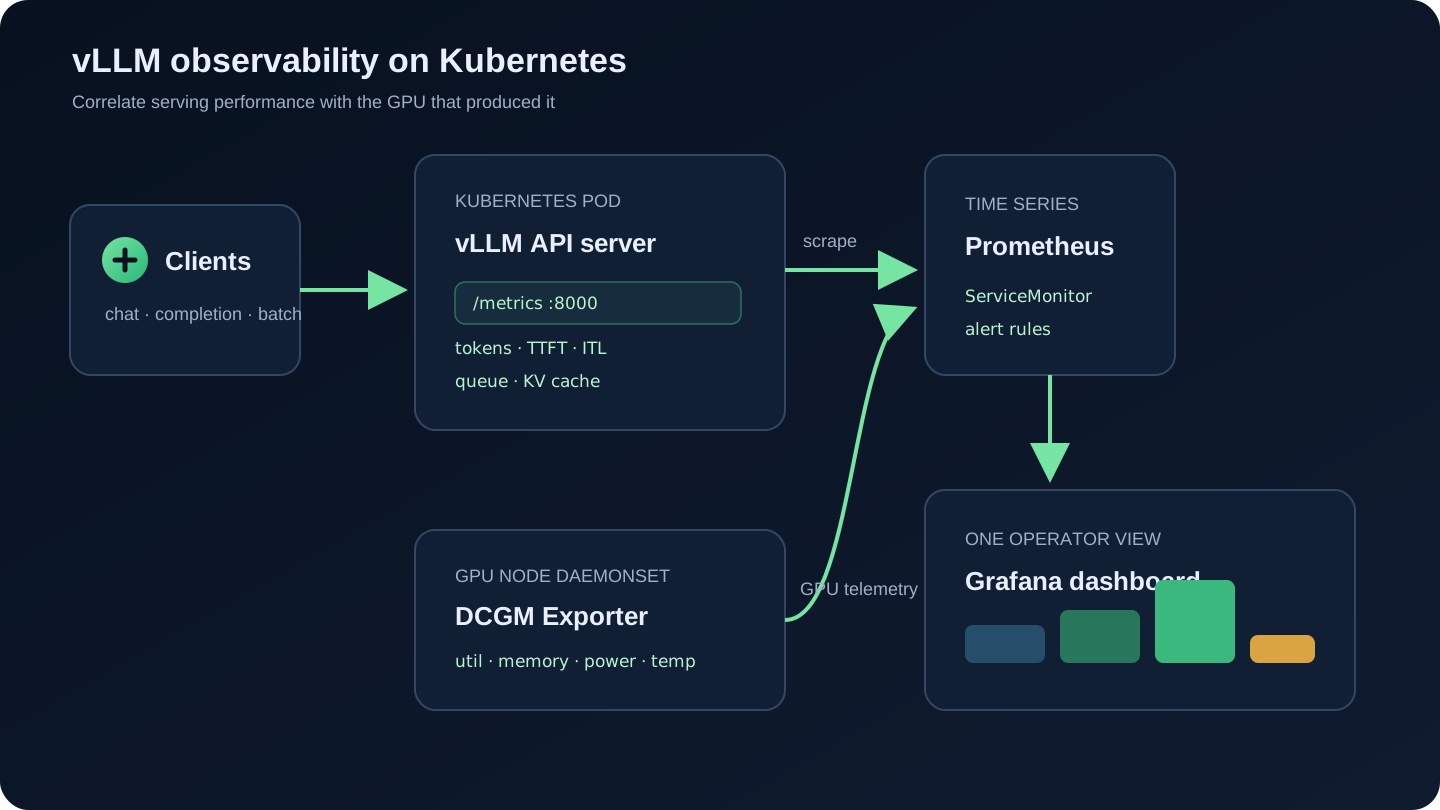
The four signals that matter
Start with four questions rather than collecting every available metric.
| Question | vLLM or DCGM signal | What it tells you |
|---|---|---|
| How much work is served? | Prompt and generation tokens per second | Throughput and workload mix |
| What does a user experience? | TTFT, inter-token latency, end-to-end latency | Responsiveness before and during generation |
| Is the scheduler under pressure? | Running requests, waiting requests, KV cache usage | Saturation and admission pressure |
| Is the accelerator the constraint? | GPU utilization, memory, power, temperature | Physical capacity, efficiency, and health |
Do not treat any one metric as a capacity verdict. High KV cache usage with no waiting requests can be efficient. High GPU utilization with stable latency is normally desirable. A growing queue combined with rising latency and sustained GPU utilization is much stronger evidence of saturation.
Prerequisites
This guide assumes:
- vLLM's OpenAI-compatible API server is running in Kubernetes.
- Prometheus Operator and Grafana are installed, commonly through kube-prometheus-stack.
- Prometheus can discover
ServiceMonitorresources. - NVIDIA DCGM Exporter runs on GPU nodes, commonly through NVIDIA GPU Operator.
- Your vLLM version exposes production metrics at
/metricson the API port.
Metric names evolve. The examples use current vLLM V1 names such as vllm:kv_cache_usage_perc and vllm:inter_token_latency_seconds. Inspect the endpoint deployed in your cluster before building permanent dashboards:
kubectl -n llm port-forward service/vllm 8000:8000
curl --fail http://127.0.0.1:8000/metrics | grep '^vllm:' | head
The vLLM production metrics reference is the source of truth for the release you operate. Avoid deprecated names such as vllm:gpu_cache_usage_perc and vllm:time_per_output_token_seconds when their replacements are available.
Step 1: expose the vLLM metrics endpoint
The OpenAI-compatible vLLM server exposes Prometheus metrics on /metrics by default. The Kubernetes Service must expose the API port with a stable name because a ServiceMonitor selects a Service port by name.
apiVersion: v1
kind: Service
metadata:
  name: vllm
  namespace: llm
  labels:
    app.kubernetes.io/name: vllm
spec:
  selector:
    app.kubernetes.io/name: vllm
  ports:
    - name: http
      port: 8000
      targetPort: 8000
Do not expose /metrics through a public Ingress just to make Prometheus reach it. Scrape the ClusterIP Service inside the cluster and apply your normal NetworkPolicy controls.
Verify the endpoint from inside the cluster or through a temporary port-forward:
kubectl -n llm get service,endpointslice -l app.kubernetes.io/name=vllm
kubectl -n llm port-forward service/vllm 8000:8000
curl --fail http://127.0.0.1:8000/metrics
Step 2: add a ServiceMonitor
Create a ServiceMonitor whose selector matches the Service labels. Its own labels must also match the selectors on your Prometheus resource.
apiVersion: monitoring.coreos.com/v1
kind: ServiceMonitor
metadata:
  name: vllm
  namespace: monitoring
  labels:
    release: kube-prometheus-stack
spec:
  namespaceSelector:
    matchNames:
      - llm
  selector:
    matchLabels:
      app.kubernetes.io/name: vllm
  endpoints:
    - port: http
      path: /metrics
      interval: 15s
      scrapeTimeout: 10s
The release label is only an example. Check spec.serviceMonitorSelector and spec.serviceMonitorNamespaceSelector on the Prometheus custom resource in your cluster.
kubectl -n monitoring get prometheus -o yaml
kubectl -n monitoring get servicemonitor vllm -o yaml
In the Prometheus UI, confirm the target is UP, then run these smoke-test queries:
up{job=~".*vllm.*"}
vllm:num_requests_running
vllm:kv_cache_usage_perc
Step 3: measure token throughput correctly
Requests are a poor unit of LLM work. One request may contain 20 prompt tokens and another 20,000. Track prompt and generation tokens separately:
sum by (model_name) (
  rate(vllm:prompt_tokens_total[5m])
)
sum by (model_name) (
rate(vllm:generation_tokens_total[5m])
)These produce tokens per second over a five-minute window. Prompt throughput describes prefill work; generation throughput describes decode work. Their hardware behavior differs, so the split is more useful than total tokens alone.
For per-pod capacity and load imbalance, retain the Kubernetes pod label added by service discovery:
sum by (pod, model_name) (
  rate(vllm:generation_tokens_total[5m])
)
If one replica consistently processes fewer tokens while traffic should be balanced, inspect routing, model configuration, readiness, and GPU health. Never add request_prompt_tokens_sum to prompt_tokens_total; they represent overlapping observations and would double-count work.
Step 4: chart TTFT, inter-token latency, and end-to-end latency
LLM latency has distinct phases:
- Time to first token (TTFT) includes scheduler waiting and prefill before streaming begins.
- Inter-token latency (ITL) measures gaps between successive output tokens during decode.
- End-to-end latency measures the whole request and depends heavily on output length.
Use histogram_quantile over the histogram bucket rate. A fleet-wide p95 TTFT is:
histogram_quantile(
  0.95,
  sum by (le, model_name) (
    rate(vllm:time_to_first_token_seconds_bucket[5m])
  )
)
For p95 inter-token latency:
histogram_quantile(
  0.95,
  sum by (le, model_name) (
    rate(vllm:inter_token_latency_seconds_bucket[5m])
  )
)
For p95 end-to-end request latency:
histogram_quantile(
  0.95,
  sum by (le, model_name) (
    rate(vllm:e2e_request_latency_seconds_bucket[5m])
  )
)
Aggregate bucket rates first and calculate the quantile second. Averaging per-pod p95 values is statistically invalid. Preserve le in the aggregation or histogram_quantile cannot reconstruct the distribution.
Use queue and phase histograms to explain a regression:
histogram_quantile(0.95,
  sum by (le, model_name) (rate(vllm:request_queue_time_seconds_bucket[5m]))
)
histogram_quantile(0.95,
sum by (le, model_name) (rate(vllm:request_prefill_time_seconds_bucket[5m]))
)If TTFT rises with queue time, capacity or scheduling is likely involved. If prefill time rises without a queue, look at prompt length, prefix-cache effectiveness, GPU performance, and model configuration.
Step 5: watch the scheduler and KV cache
The most direct scheduler panels are running and waiting requests:
sum by (model_name) (vllm:num_requests_running)sum by (model_name) (vllm:num_requests_waiting)A nonzero waiting gauge is not automatically an incident. A queue that persists while TTFT rises is actionable. Chart it beside KV cache usage:
100 * max by (pod, model_name) (vllm:kv_cache_usage_perc)vllm:kv_cache_usage_perc is a fraction: 1 means 100 percent. KV cache holds attention keys and values for active sequences and cached prefixes. Its pressure depends on model shape, cache dtype, sequence lengths, concurrency, parallelism, and configured GPU memory utilization.
High KV cache usage can be healthy when latency and queues are stable. Sustained pressure combined with waiting requests or preemptions signals a real limit. Monitor the preemption counter as a rate:
sum by (pod, model_name) (
  rate(vllm:num_preemptions_total[5m])
)
Check the exact exported counter suffix in your version. Prometheus client libraries conventionally expose counters with _total, while documentation may show the family name without that suffix.
If automatic prefix caching is enabled, calculate its token hit ratio:
sum(rate(vllm:prefix_cache_hits_total[5m]))
/
clamp_min(sum(rate(vllm:prefix_cache_queries_total[5m])), 1)
Interpret this with workload knowledge. A low hit ratio is expected when prompts share little reusable prefix text.
Step 6: add NVIDIA GPU metrics
vLLM metrics describe the engine, not the physical accelerator. DCGM Exporter fills that gap and normally runs as a DaemonSet through NVIDIA GPU Operator. Confirm Prometheus has both targets:
up{job=~".*(vllm|dcgm).*"}Useful GPU panels include utilization:
avg by (node, gpu) (DCGM_FI_DEV_GPU_UTIL)Framebuffer memory percentage:
100 * DCGM_FI_DEV_FB_USED
/
(DCGM_FI_DEV_FB_USED + DCGM_FI_DEV_FB_FREE)
Power and temperature:
avg by (node, gpu) (DCGM_FI_DEV_POWER_USAGE)max by (node, gpu) (DCGM_FI_DEV_GPU_TEMP)The labels available on DCGM metrics depend on exporter configuration. With Kubernetes pod mapping enabled, current DCGM Exporter can add pod, namespace, and container. Inspect one series before writing joins:
DCGM_FI_DEV_GPU_UTILGPU framebuffer usage is not the same as KV cache usage. Model weights, CUDA graphs, activations, allocator reserves, and KV cache all consume device memory. Use the DCGM panel for physical memory and the vLLM panel for the engine's allocated KV-block pool.
A practical Grafana dashboard
Arrange the dashboard so operators can scan from user impact to root cause.
| Row | Panels |
|---|---|
| Traffic | Request rate, prompt tokens/s, generation tokens/s, success by finish reason |
| User latency | p50/p95/p99 TTFT, p95 ITL, p95 end-to-end latency |
| Scheduler | Running requests, waiting requests, queue time, preemptions |
| Cache | KV cache usage by pod, prefix-cache hit ratio |
| GPU | Utilization, framebuffer memory, power, temperature, XID or health signals |
| Kubernetes | Ready replicas, restarts, CPU and memory, Prometheus target health |
Add variables for namespace, model_name, and pod. Keep an unfiltered fleet overview as the entry point; dashboards that require three variable selections before showing a problem slow down incident response.
Use the same time range and vertical annotations for rollouts, autoscaling events, and configuration changes. Correlation becomes much easier when a TTFT jump and a deployment appear on the same timeline.
Alerts that combine symptoms
Page on sustained user impact, not every momentary utilization spike. Recording rules are helpful for expensive histogram queries, but direct rules illustrate the logic.
groups:
  - name: vllm-serving
    rules:
      - alert: VLLMHighP95TTFT
        expr: |
          histogram_quantile(
            0.95,
            sum by (le, namespace, model_name) (
              rate(vllm:time_to_first_token_seconds_bucket[5m])
            )
          ) > 2
        for: 10m
        labels:
          severity: warning
        annotations:
          summary: "vLLM p95 time to first token is above 2 seconds"

      - alert: VLLMSustainedQueueAndCachePressure
        expr: |
          sum by (namespace, model_name) (vllm:num_requests_waiting) > 0
          and on (namespace, model_name)
          max by (namespace, model_name) (vllm:kv_cache_usage_perc) > 0.90
        for: 10m
        labels:
          severity: warning
        annotations:
          summary: "vLLM has a persistent queue with KV cache above 90%"

      - alert: VLLMMetricsMissing
        expr: absent(vllm:num_requests_running)
        for: 5m
        labels:
          severity: critical
        annotations:
          summary: "Prometheus is not receiving vLLM engine metrics"
Tune thresholds to an explicit SLO and workload. A two-second TTFT may be unacceptable for interactive chat and harmless for an offline batch endpoint. In a multi-tenant Prometheus system, scope absent() rules by the expected job or service so one healthy deployment does not hide another missing deployment.
Kubernetes autoscaling considerations
CPU utilization is usually a weak scaling signal for GPU inference. Waiting requests, queue time, or request concurrency are closer to demand, but safe autoscaling still requires care:
- New replicas may spend minutes pulling weights and loading a model.
- A pod is not capacity until the model is loaded and readiness succeeds.
- Scale-down must drain requests instead of terminating active generations.
- Every replica needs schedulable GPU capacity; a desired replica is not a running replica.
- KV cache usage is a saturation signal, not a direct replica-count formula.
Export a stable Prometheus query through your chosen autoscaling adapter and test cold-start behavior under controlled load. Maintain enough warm capacity for the startup time your SLO can tolerate.
Troubleshooting empty or misleading panels
### /metrics works locally but Prometheus has no target
Check the Service selector, named port, ServiceMonitor selector, namespace selector, and Prometheus ServiceMonitor selectors. A valid custom resource can still be ignored.
kubectl -n llm get service vllm -o yaml
kubectl -n monitoring get servicemonitor vllm -o yaml
kubectl -n monitoring get prometheus -o yaml
### The target is up but vllm: metrics are missing
Query the pod endpoint directly and confirm you are scraping the vLLM API port and /metrics, not an Ingress controller or a sidecar. Some families do not appear until traffic exercises that path.
### PromQL returns “no data” after an upgrade
Compare the live endpoint with the metric reference for the installed version. vLLM has a metric deprecation policy, so old dashboard names eventually disappear. Update dashboards and alerts as part of the application upgrade, not after an incident.
### Latency is high while GPU utilization is low
Inspect waiting time, prompt sizes, request routing, CPU throttling, tokenizer work, storage, networking, and uneven replicas. Low GPU utilization rules out neither a frontend bottleneck nor bursty traffic hidden by a long averaging window.
### GPU utilization is high but token throughput fell
Compare prompt versus generation throughput, average request sizes, cache hit ratio, clock and power signals, and software changes. A shift toward long prompts can consume more prefill compute while producing fewer output tokens.
### DCGM metrics cannot be matched to a pod
Confirm DCGM Exporter Kubernetes mapping and kubelet pod-resources access. Label schemas differ between releases and deployment modes. Prefer labels observed at your live /metrics endpoint over copied dashboard assumptions.
Production checklist
- Pin and test vLLM, GPU driver, DCGM Exporter, and monitoring chart versions.
- Scrape vLLM and DCGM Exporter independently and alert when either source disappears.
- Track prompt and generation throughput separately.
- Chart TTFT, ITL, queue time, and end-to-end latency as distributions.
- Treat KV cache, scheduler queues, preemptions, and GPU utilization as correlated signals.
- Preserve
namespace,pod, andmodel_namelabels without adding unbounded labels such as request IDs. - Define latency and availability SLOs before choosing alert thresholds.
- Load-test dashboards, alerts, and autoscaling before production traffic depends on them.
- Review live metric names during every vLLM upgrade.
The central idea is simple: vLLM tells you how the inference engine is behaving, while DCGM Exporter tells you what the GPU is doing. Put both timelines in the same operational view and most performance investigations become faster, more precise, and easier to automate.